Legend:
Library
Module
Module type
Parameter
Class
Class type
Library
Module
Module type
Parameter
Class
Class type
module Align : sig ... endmodule Anchor : sig ... endmodule Visibility : sig ... endmodule Text_align : sig ... endclass type font = object ... endclass type optionContext = object ... endclass type listeners = object ... endtype 'a prop =
(optionContext Js_of_ocaml.Js.t, 'a) Chartjs.Scriptable_indexable.t
Js_of_ocaml.Js.ttype 'a formatter =
('a ->
optionContext Js_of_ocaml.Js.t ->
Js_of_ocaml.Js.js_string Js_of_ocaml.Js.t)
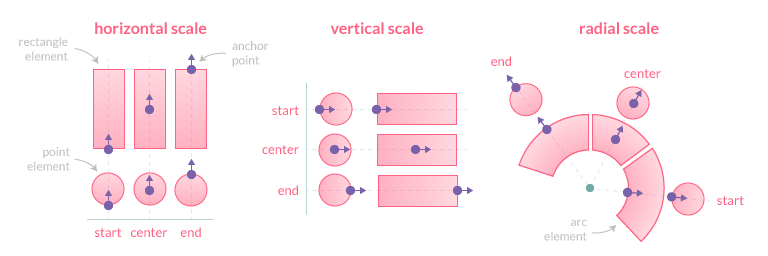
Js_of_ocaml.Js.callbackclass type datalabels = object ... endval empty_font : unit -> font Js_of_ocaml.Js.tval empty_listeners : unit -> listeners Js_of_ocaml.Js.tval empty_datalabels_config : unit -> datalabels Js_of_ocaml.Js.tAn anchor point is defined by an orientation vector and a position on the data element. The orientation depends on the scale type (vertical, horizontal or radial). The position is calculated based on the datalabels.anchor option and the orientation vector.
Possible anchor values are defined in the Anchor module.
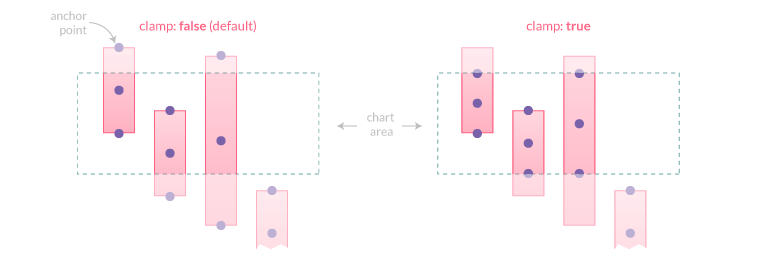
The datalabels.clamp option, when true, enforces the anchor position to be calculated based on the visible geometry of the associated element (i.e. part inside the chart area).
NOTE: If the element is fully hidden (i.e. entirely outside the chart area), anchor points will not be adjusted and thus will also be outside the viewport.
The datalabels.align option defines the position of the label relative to the anchor point position and orientation. Its value can be expressed either by a number representing the clockwise angle (in degree) or by one of the predefined string values.
Possible values for datalabels.align option are defined in the Align module.
The datalabels.offset option represents the distance (in pixels) to pull the label away from the anchor point. This option is not applicable when align is Align.center. Also note that if datalabels.align is Align.start, the label is moved in the opposite direction. The default value is 4.

The datalabels.rotation option controls the clockwise rotation angle (in degrees) of the label, the rotation center point being the label center. The default value is 0 (no rotation).
The datalabels.display option controls the visibility of labels. The option is scriptable, so it's possible to show/hide specific labels.
Possible values are defined in the Visibility module.
The Visibility.auto option can be used to prevent overlapping labels, based on the following rules when two labels overlap:
datalabels.display option set to true, they will be drawn overlappingdatalabels.display option set to Visibility.auto, the one with the highest data index will be hidden. If labels are at the same data index, the one with the lowest dataset index will be hiddendatalabels.display option set to true and the other one has Visibility.auto, the one with Visibility.auto will be hidden (whatever the data/dataset indices)When the datalabels.clip option is true, the part of the label which is outside the chart area will be masked.
For more information, see MDN
The datalabels.textAlign option only applies to multiline labels and specifies the text alignment being used when drawing the label text.
NOTE: right-to-left text detection based on the current locale is not currently implemented.
Possible values are defined in the Text_align module.
For more information, see MDN
The datalabels.listeners option allows to register callbacks to be notified when an event is detected on a specific label. This option is an object where the property is the type of the event to listen and the value is a callback with a unique context argument.
The context contains the same information as for scriptable options, can be modified (e.g. add new properties) and thus, if the callback explicitly returns true, the label is updated with the new context and the chart re-rendered. This allows to implement visual interactions with labels such as highlight, selection, etc.
Listeners can be registered for any label (options.plugin.datalabels.listener.*) or for labels of a specific dataset (dataset.datalabels.listeners.*).
Tip: If no listener is registered, incoming events are immediately ignored, preventing extra computation such as intersecting label bounding box. That means there should be no performance penalty for configurations that don't use events.
val of_dataset :
  Chartjs.dataset Js_of_ocaml.Js.t ->
  datalabels Js_of_ocaml.Js.t Js_of_ocaml.Js.optdef
val of_chart_options :
Chartjs.chartOptions Js_of_ocaml.Js.t ->
datalabels Js_of_ocaml.Js.t Js_of_ocaml.Js.optdefval of_global : unit -> datalabels Js_of_ocaml.Js.t Js_of_ocaml.Js.optdefval set_to_dataset :
Chartjs.dataset Js_of_ocaml.Js.t ->
datalabels Js_of_ocaml.Js.t ->
unitval set_to_chart_options :
Chartjs.chartOptions Js_of_ocaml.Js.t ->
datalabels Js_of_ocaml.Js.t ->
unitval set_globally : datalabels Js_of_ocaml.Js.t -> unitThe plugin options can be changed at 3 different levels and are evaluated with the following priority:
To configure the plugin for a dataset, use set_per_dataset, of_dataset.
To configure the plugin for a chart, use set_per_chart, of_chart.
To configure the plugin globally, use set_globally, of_global.